
Scientific figure tools
Tools built for research communication
Generate academic illustrations, graphical abstracts, and conference posters with focused workflows.
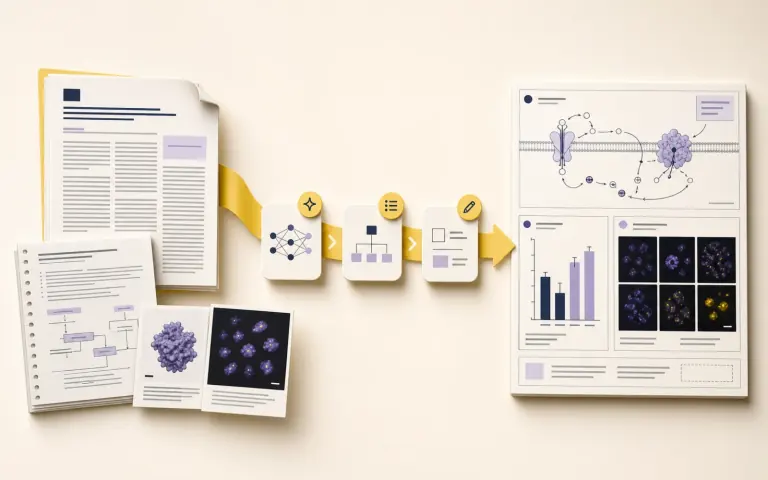

Paper Banana
Turn research briefs into polished academic figures.
Explore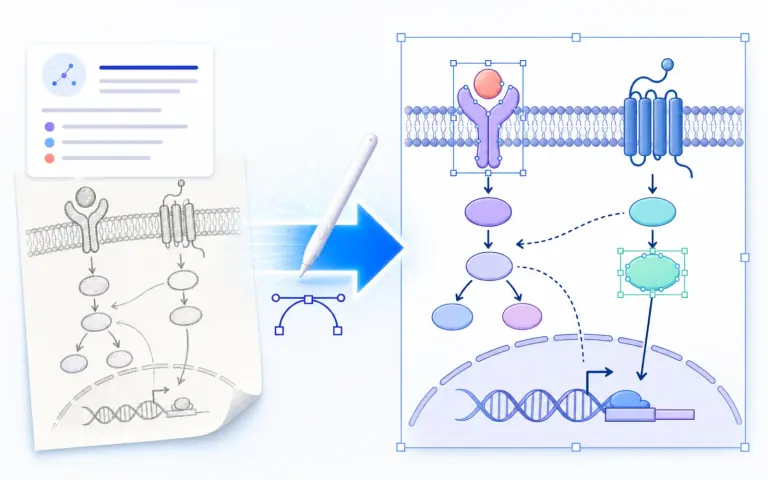

AI Scientific Illustration
Generate editable scientific illustrations and SVG drafts.
Explore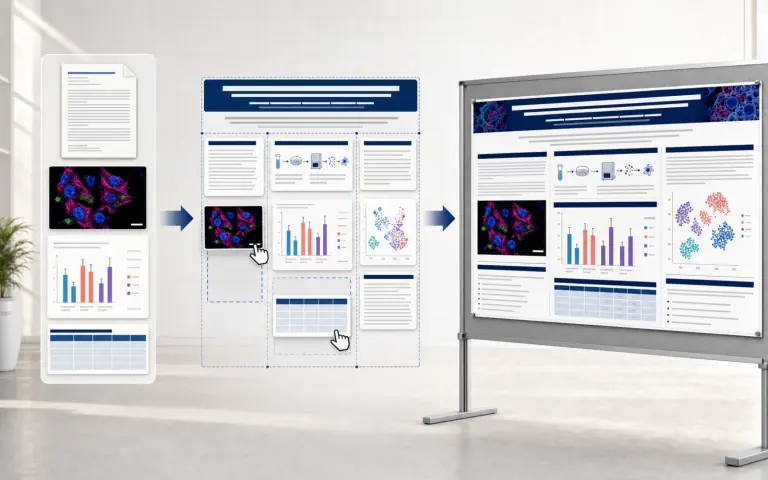

Scientific Poster Maker
Build conference-ready scientific posters from your content.
Explore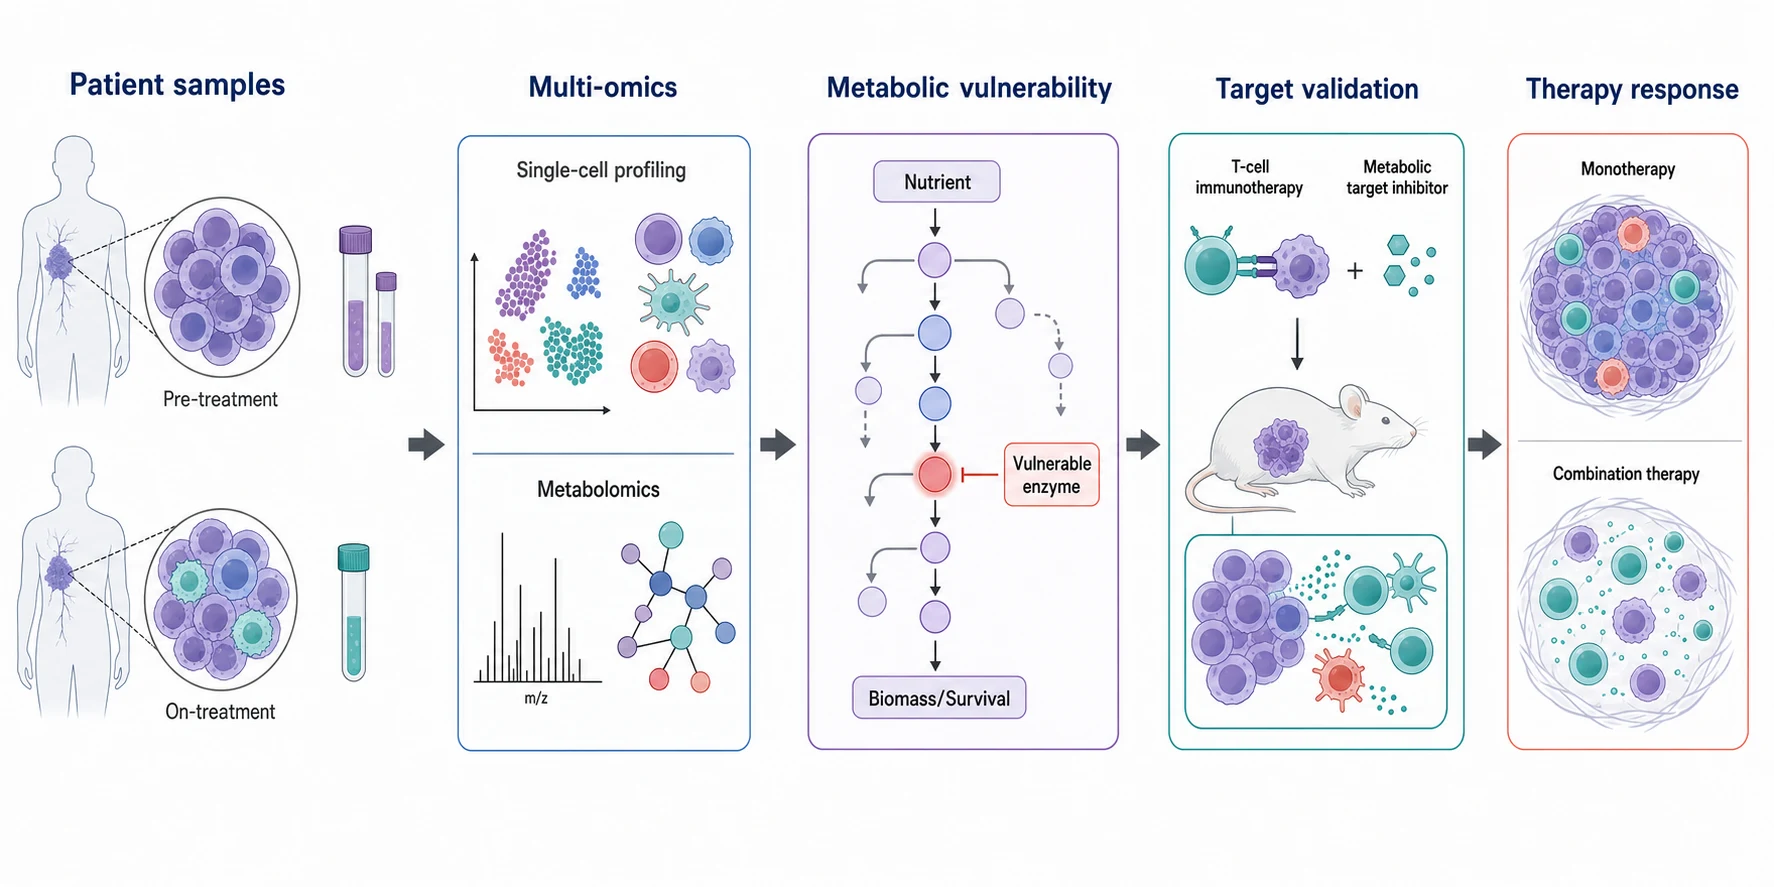
Graphical Abstract Maker
Turn a research abstract into an editable visual story.
Explore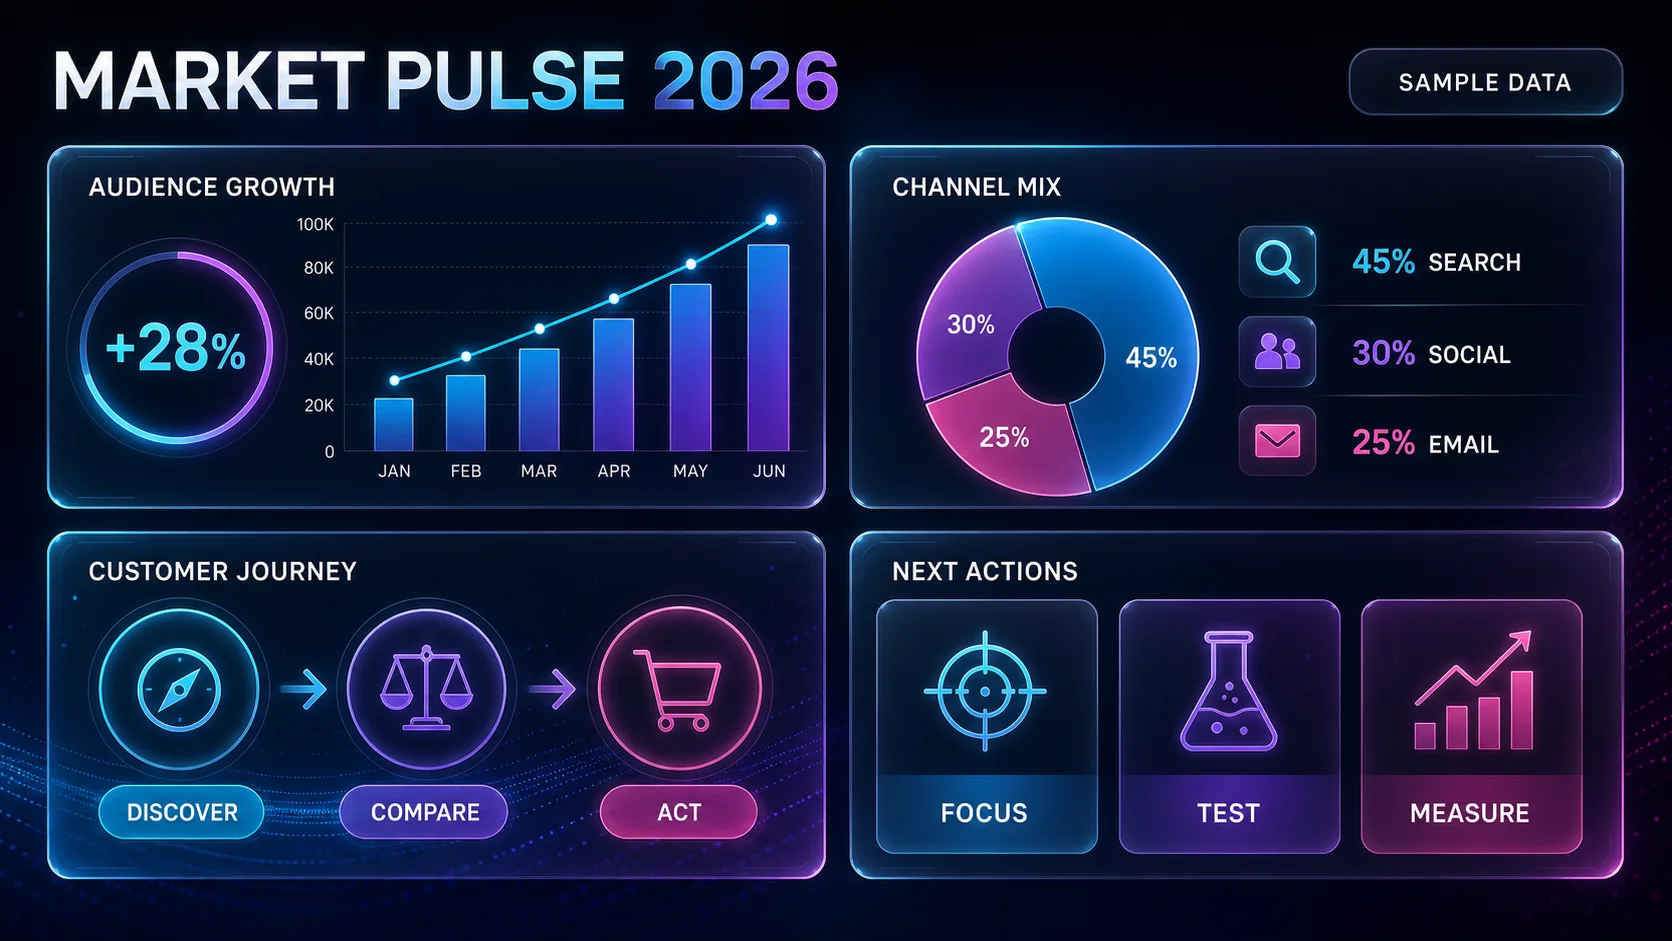
AI Infographic Generator
Create editable visual stories from text, facts, and data.
Explore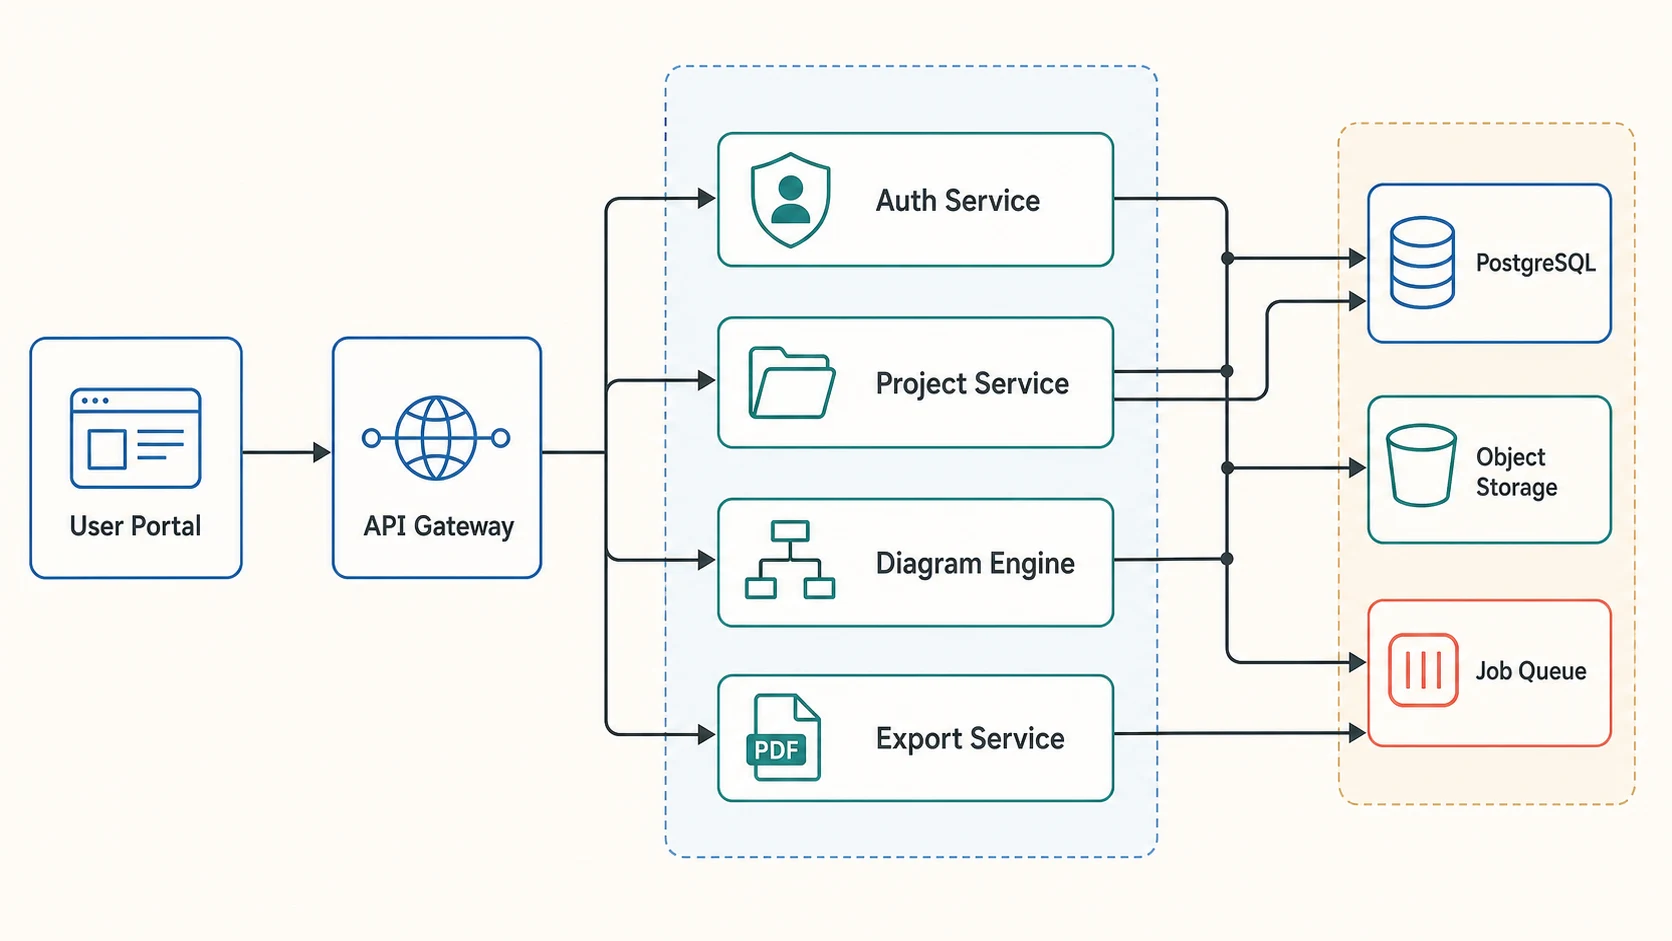
Text to Diagram Generator
Convert descriptions into clear, editable diagrams.
Explore
Conceptual Framework Generator
Map research variables, hypotheses, mediators, and moderators.
Explore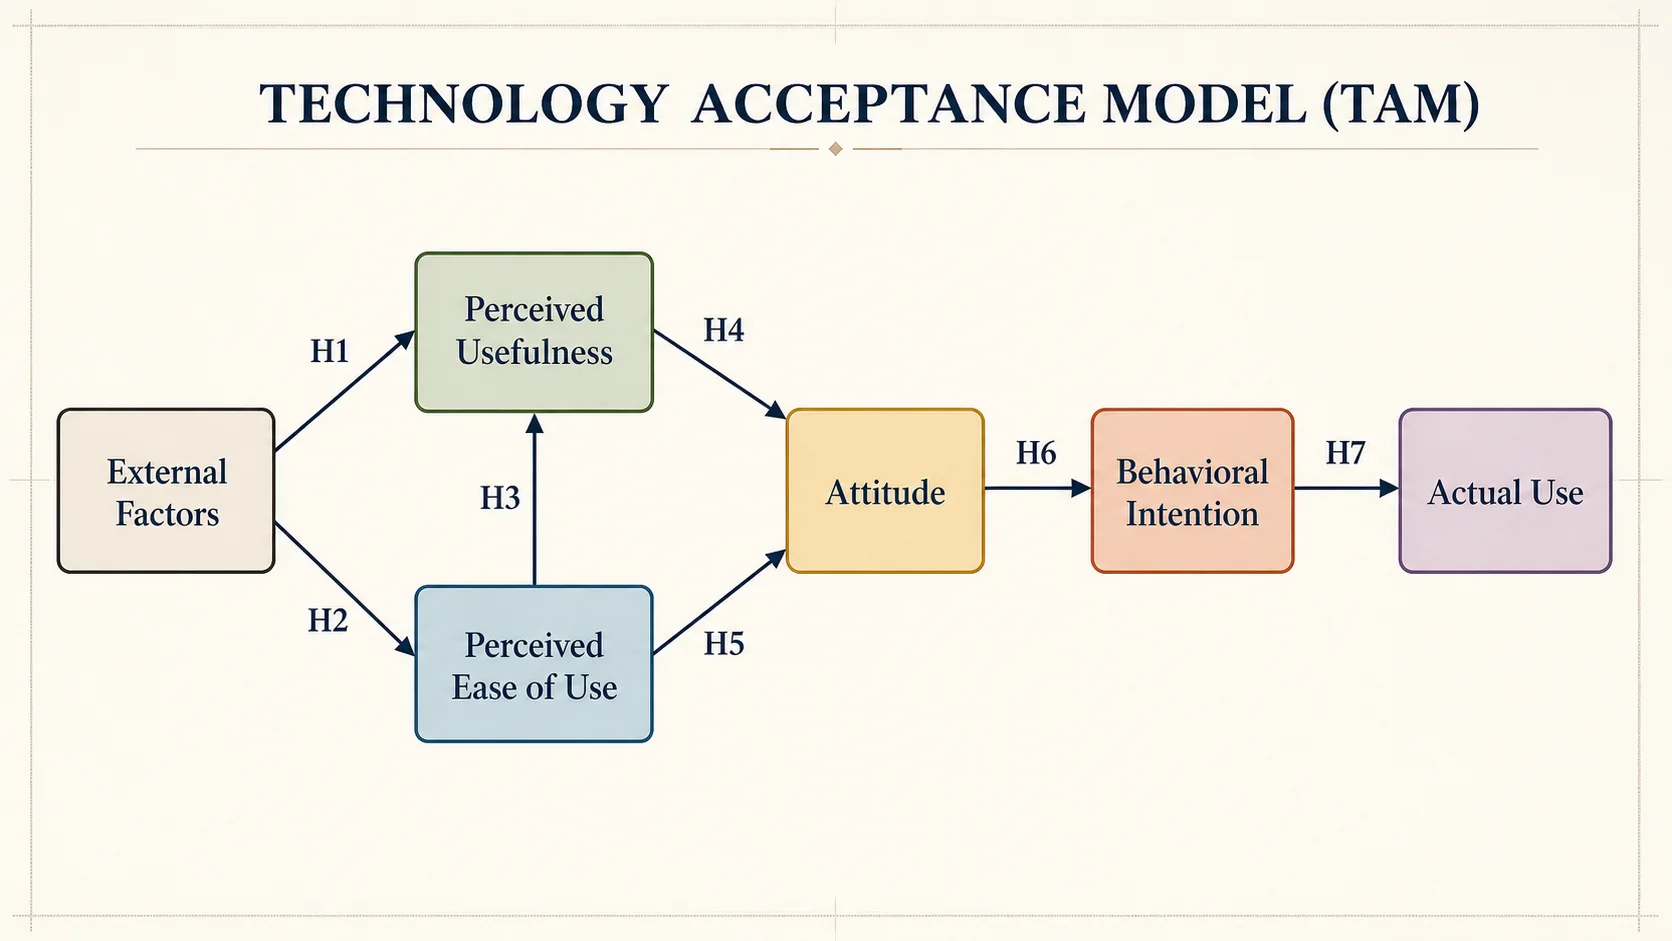
Theoretical Framework Generator
Theoretical Framework Generator turns an established theory into an editable diagram for a thesis, dissertation, proposal, or paper. Map constructs, propositions, and hypothesis paths, then verify every relationship in FigEditor.
Explore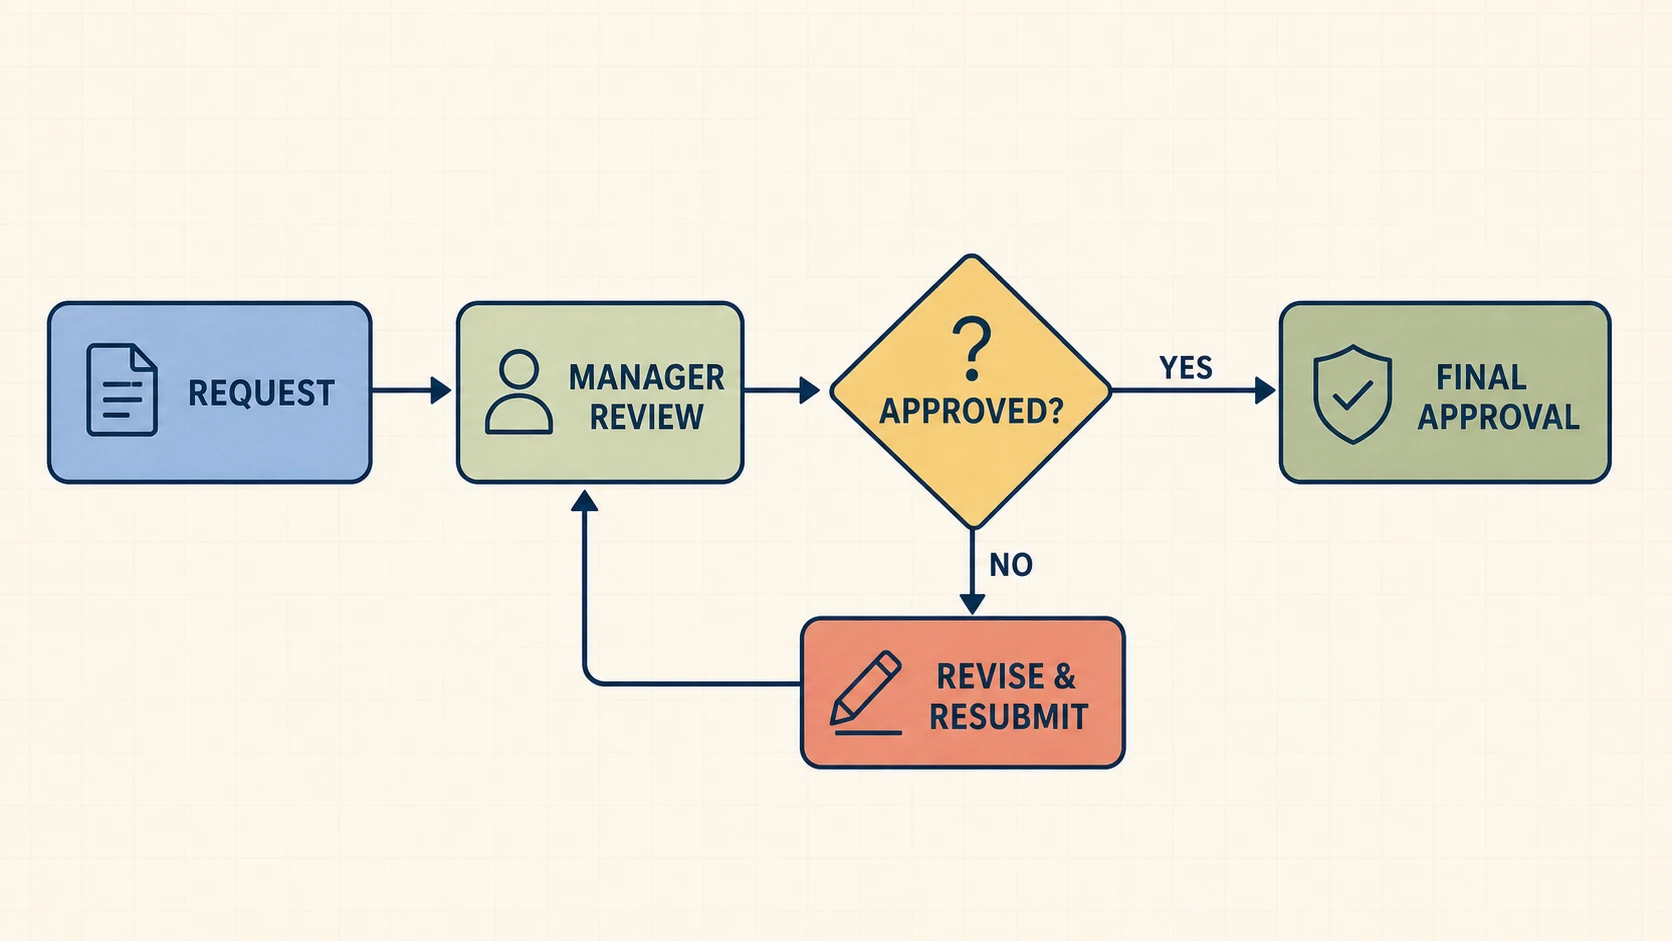
AI Flowchart Generator
FigEditor's AI Flowchart Generator turns a plain-English process into a polished flowchart image. Choose an image model, preserve labeled decisions and loops, and download the result in high resolution.
Explore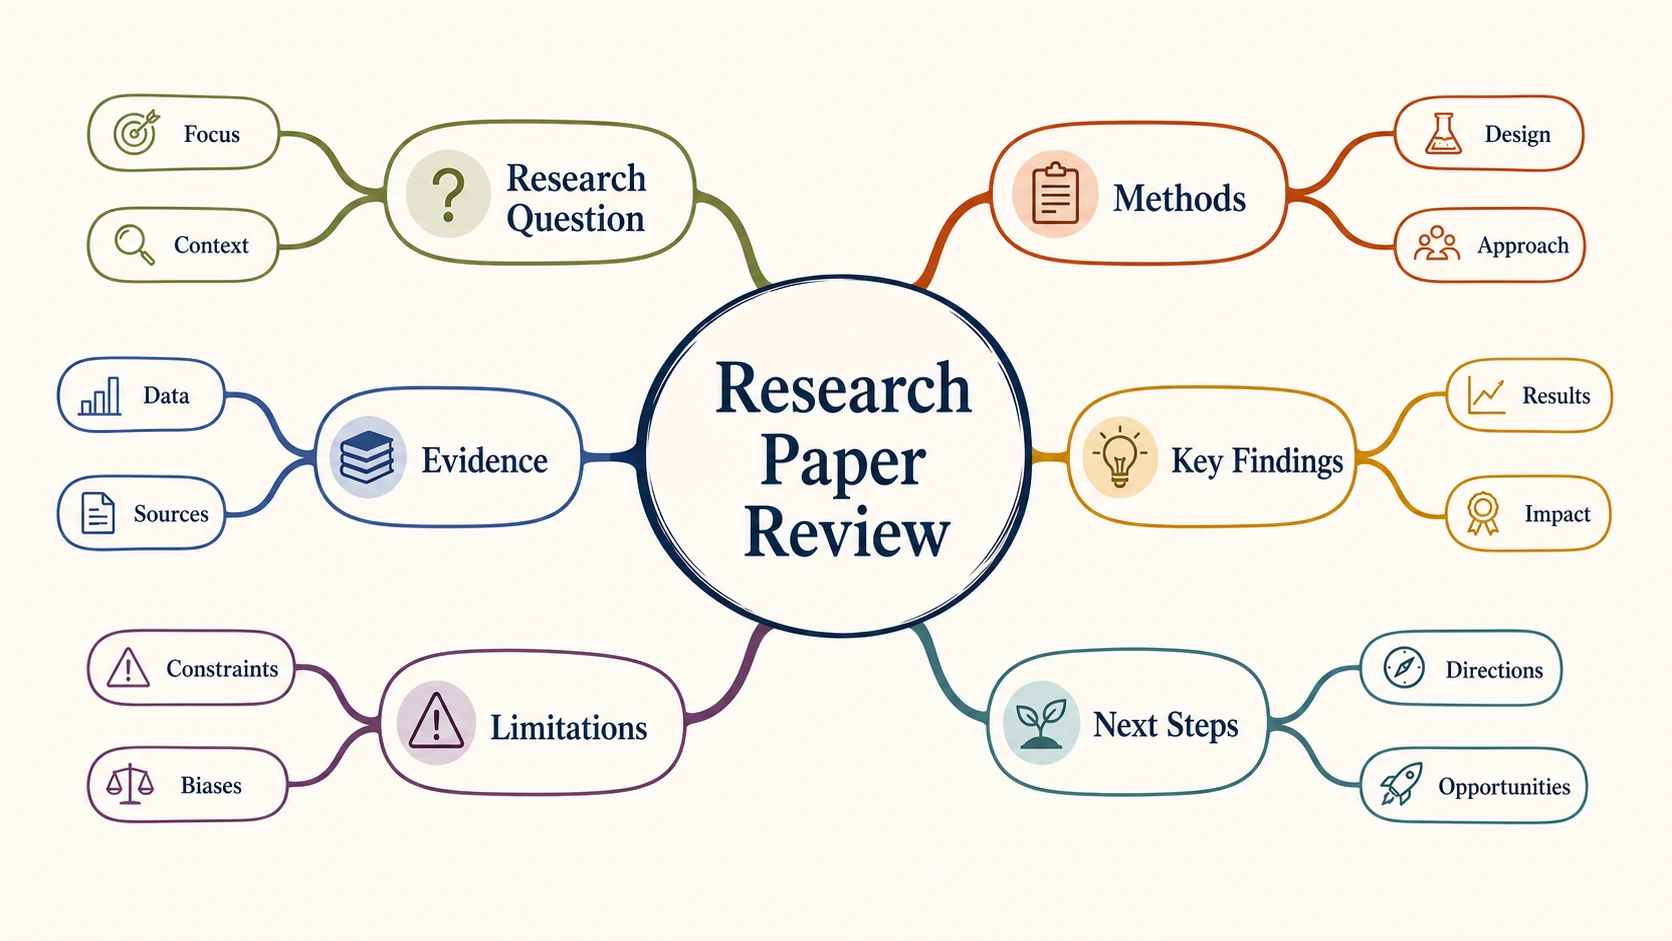
AI Mind Map Generator
Mind Map Generator turns a topic, pasted notes, or an outline into a clear radial visual. FigEditor asks the selected image model to organize the central idea, main branches, and supporting subtopics for study, research, brainstorming, project planning, and presentations.
Explore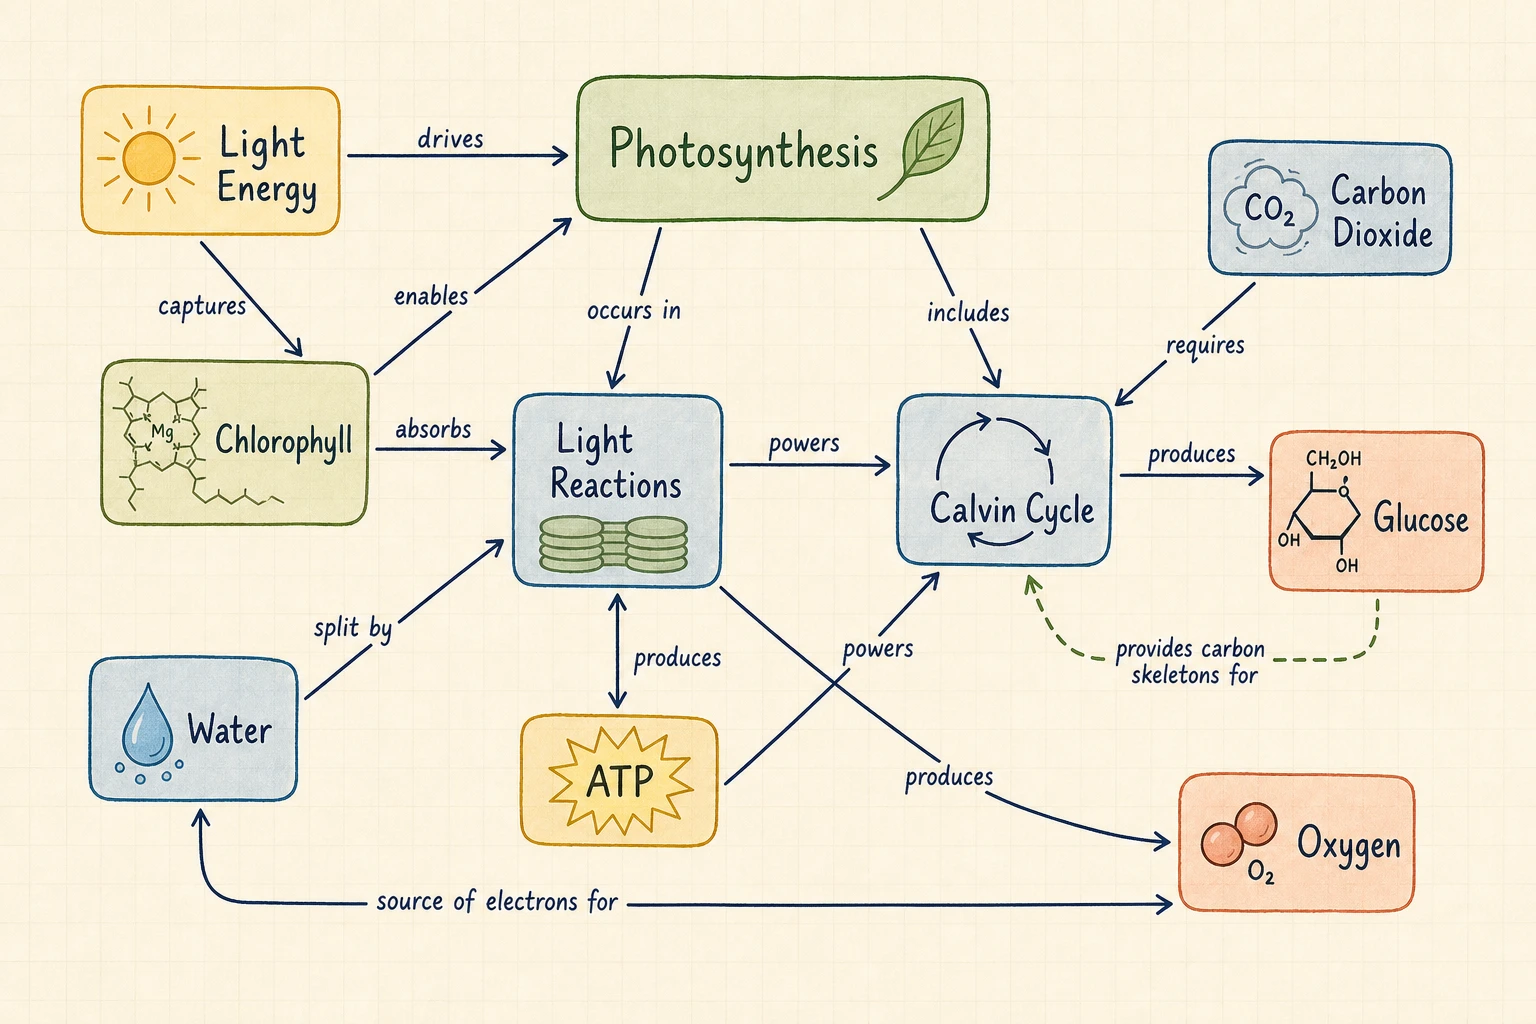
Concept Map Generator
Concept Map Generator turns a topic, notes, or source summary into a visual where every connection explains the relationship. Generate labeled links and cross-links, then review and refine the image in FigEditor.
Explore
Journal Cover Maker
Describe the theme, audience, palette, and imagery, then choose an image model, cover style, ratio, and resolution. Create artwork for KDP low-content books, school notebooks, planners, lab journals, reading logs, and personal diaries, then refine the title and layout in FigEditor.
Explore
AI Chart Generator
Use the AI Chart Generator to paste rows from Excel or CSV, enter text values, or describe a chart. It creates an image-based visual draft that you can refine in FigEditor; it does not directly parse spreadsheet files, and every label, axis, and data point still requires review.
ExploreColumn Chart Maker
Paste spreadsheet data or upload CSV, then create grouped, stacked, and 100% stacked charts. Every bar is rendered from your values in the browser—no image credits and no invented data.
ExploreBar Chart Maker
Paste label-and-value rows to create accurate bar charts. Compare categories, switch orientation, and download an editable chart directly in your browser.
ExplorePie Chart Maker
Convert label-and-value rows into an accurate Pie or Donut chart. Percentages are calculated in your browser, and the result downloads as an editable SVG without sign-up.
ExploreHeatmap Generator
Turn a labeled matrix into a readable color map. Compare exact values across rows and columns, switch color scales, and export SVG or PNG directly in your browser.
ExploreImage to SVG Converter
Turn PNG, JPG, or WebP figures into layered vector SVG files. Tracing runs entirely in your browser, so your images never leave your device and no credits are used.
Explore