
Okabe Ito Palette: Exact Colors and Accessible Usage Guide
Use this Okabe Ito palette reference to copy all 8 hex and RGB values, add them in Python, R, MATLAB, and CSS, and check accessibility limits.
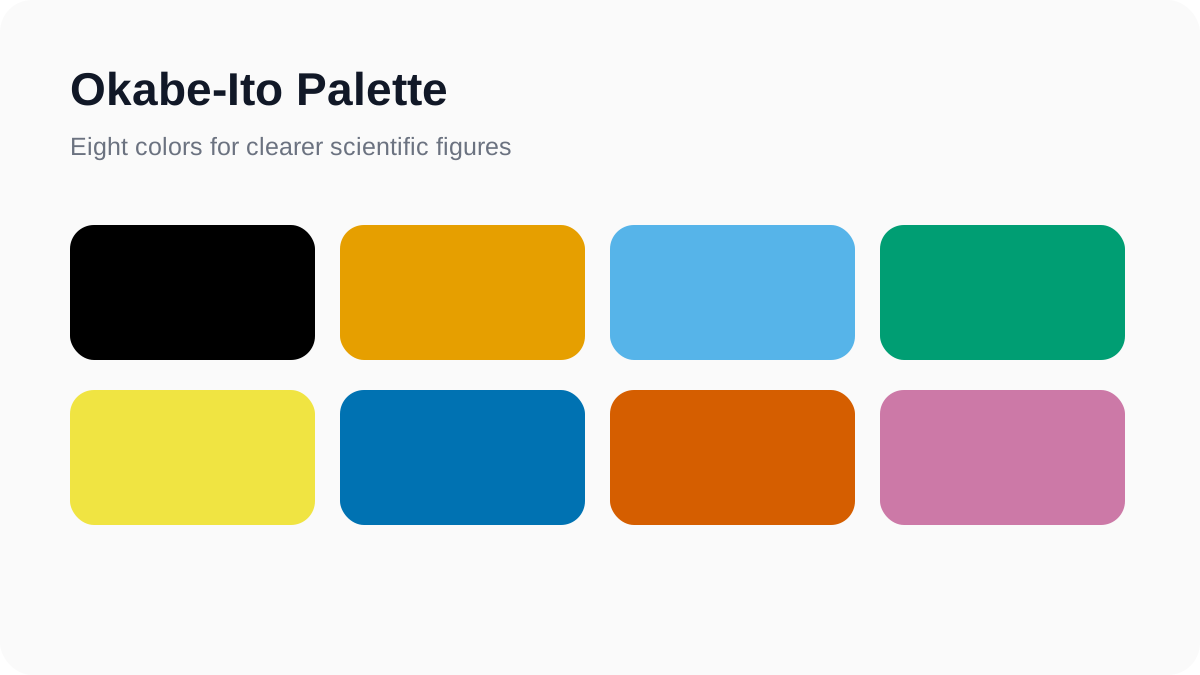
The Okabe-Ito palette is a widely used color set for scientific graphics because its hues remain relatively distinguishable for many viewers with common color-vision deficiencies.
The eight Okabe Ito colors
| Name | Hex | RGB |
|---|---|---|
| Black | #000000 | 0, 0, 0 |
| Orange | #E69F00 | 230, 159, 0 |
| Sky blue | #56B4E9 | 86, 180, 233 |
| Bluish green | #009E73 | 0, 158, 115 |
| Yellow | #F0E442 | 240, 228, 66 |
| Blue | #0072B2 | 0, 114, 178 |
| Vermillion | #D55E00 | 213, 94, 0 |
| Reddish purple | #CC79A7 | 204, 121, 167 |
Use the palette in Python
Store the hex values in a list or plotting-theme constant, then assign colors consistently by semantic category rather than by chart order.
Use the palette in R
Create a named character vector and pass it to your scale function. Named colors make the mapping stable when factor order changes.
Use the palette in MATLAB
Convert RGB values from the 0–255 range to 0–1 before assigning them to axes or plot objects.
Use the palette in CSS
Define the colors as custom properties when the same palette is reused across web figures, legends, and interactive visualizations.
Accessibility limits
No color palette makes every visualization accessible by itself. Combine color with labels, marker shapes, line styles, spacing, or direct annotation. Check foreground/background contrast separately when colors carry text.
A practical scientific-figure workflow
Choose a stable mapping between category and color, preview the figure in grayscale and with a color-vision simulator, then verify that the legend is still understandable without relying on hue alone.